"Levelized Cost of Energy" is useful but misunderstood
Here is a framework for understanding energy's most popular (and most misunderstood) metric.
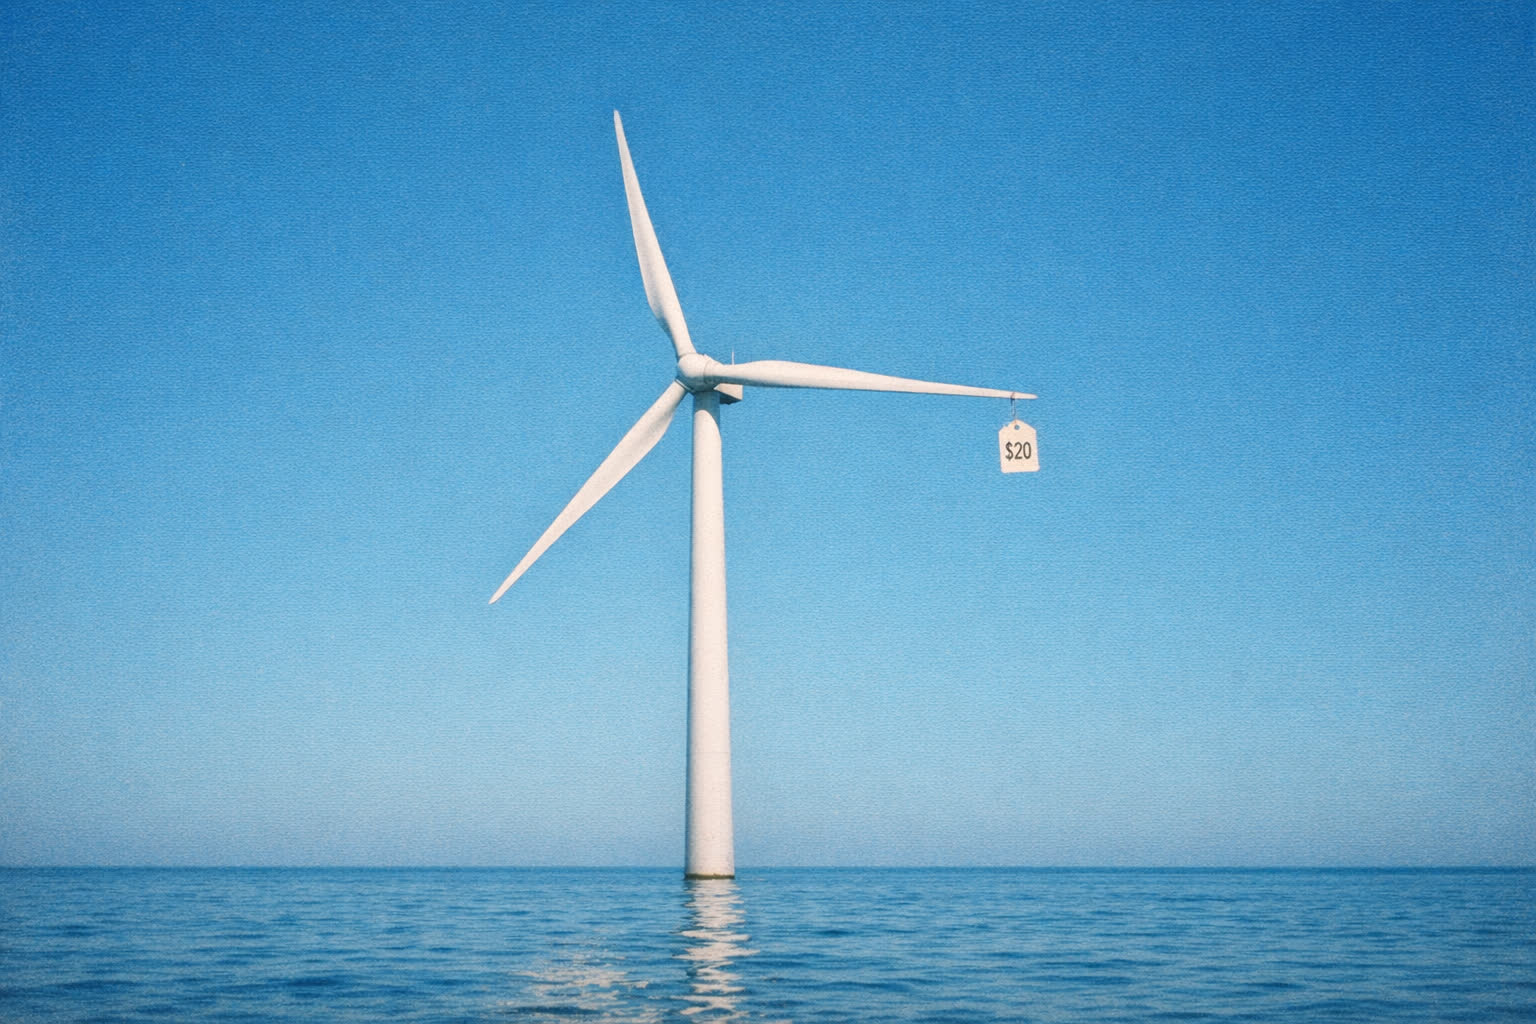
If you walk into any energy policy meeting in Jakarta, Singapore, or Dubai, you'll hear it within the first ten minutes: "What's the LCOE?"
Levelized Cost of Energy has become the default answer to "which technology is cheapest?" It's the metric that makes frequent appearances in the media and is widely used by regulators and developers to compare generation costs (WRI, 2019; Clean Air Task Force, 2025).
While LCOE is a useful metric, it doesn't tell us the full story. For one, LCOE is not a single number. Rather, it's a whole worldview packaged into a fraction. Like any worldview, it has blind spots.
This article breaks down what LCOE tells us and what it doesn't. We'll also look into where the numbers stand today, globally and in Indonesia.
What is LCOE?
Strip away the finance jargon, and LCOE is remarkably simple:
LCOE = (Total lifetime cost) ÷ (Total lifetime electricity generated)
Or, more formally:
$$LCOE = \frac{\sum_{t=0}^{n} \frac{I_t + M_t + F_t}{(1+r)^t}}{\sum_{t=0}^{n} \frac{E_t}{(1+r)^t}}$$
Where:
- I = upfront investment (building the plant)
- M = operations and maintenance (keeping it running)
- F = fuel costs (zero for solar and wind)
- E = electricity generated
- r = discount rate (the cost of money)
- t = year of the project's life
Think of it as the breakeven price — the minimum price per kilowatt-hour the project needs to sell at to cover all its costs over its lifetime (Corporate Finance Institute).
If a solar farm has an LCOE of $44/MWh (IRENA 2025), it needs to sell electricity for at least that much to break even. Anything above that is profit. Anything below is a loss.
Where the numbers stand today (2025–2026)
Two organizations publish the most widely cited LCOE benchmarks: IRENA (global weighted average) and Lazard (US-specific, showing a cost range per technology). Here's where we are as of mid-2026.
Global: IRENA's 2025 data
Published July 2026, IRENA's Renewable Power Generation Costs in 2025 shows renewable costs stabilizing after a decade of steep declines:
| Technology | Global weighted-average LCOE (2025) |
|---|---|
| Onshore wind | $33/MWh |
| Utility solar PV | $44/MWh |
| Hydropower | $62/MWh |
| Offshore wind | $78/MWh |
| Bioenergy | $86/MWh |
| Geothermal | $89/MWh |
| Concentrated Solar Power | $115/MWh |
Some context on how far we've come: since 2010, utility-scale solar PV LCOE has fallen by 90% (from $417/MWh to $43/MWh in 2024), then stabilized at $44/MWh in 2025. Onshore wind fell 70% over the same period (from $113/MWh to $34/MWh in 2024) (IRENA, 2024).
A quick note on "weighted average": IRENA doesn't simply average every country's LCOE. They weight each data point by the amount of capacity built. For example, if China builds far more solar than a small market with expensive projects, the global number tracks closer to China's cost. That's why the weighted average of $44/MWh can be lower than the simple average across all countries. It reflects the cost of each technology in the countries where most of its capacity is built.
US: Lazard's 2026 data
Lazard's 2026 LCOE+ report shows a slightly different picture. Lazard excludes US federal tax subsidies for solar and wind, carbon pricing, and other policy incentives. So actual project economics are often better than the numbers below suggest.
| Technology | LCOE range (2026, unsubsidized) |
|---|---|
| Utility solar PV | $40–$98/MWh |
| Onshore wind | $37–$99/MWh |
| Gas combined cycle | $51–$129/MWh |
| Coal | $72–$177/MWh |
| Nuclear | $175–$255/MWh |
| Gas peaking | $144–$276/MWh |
Source: Lazard 2026 LCOE+ Report (Version 19.0)
Interestingly, Lazard's utility solar LCOE increased from $38–$78/MWh in 2025 to $40–$98/MWh in 2026, driven by higher capital costs, interest rates, and supply chain pressures. But solar and wind remain the cheapest new-build options across the range midpoints. Try comparing the 2025 report and the 2026 report.
Indonesia-specific numbers
Indonesia's LCOE picture is more complex because the cost of capital is higher and the regulatory framework is different.
Solar: Recent competitive auctions for utility-scale solar in Indonesia have achieved prices of $45–$55/MWh, well below PLN's coal generation costs of $65–$75/MWh (SUPRA International 2026). IESR's Indonesia Energy Transition Outlook 2026 notes that solar installation costs in Indonesia have dropped 57% over the last five years, and solar tariffs can now be 50% lower than PLN's existing generation costs (BPP) in 24 major grid systems.
Wind: Onshore wind in Eastern Indonesia (Merauke) achieves an estimated LCOE of $95/MWh, while Janeponto and Rote Island come in around $129/MWh (Springer 2026). This is competitive with diesel generation, which runs at $150–$200/MWh in the same regions.
Coal and gas: A 2026 market outlook (SUPRA International) puts PLN's reported coal generation costs at $65–$75/MWh — a figure SUPRA says already includes some externalities, though it still starts from a subsidized coal price under Indonesia's DMO. The gas combined cycle sits at $80–$95/MWh, with diesel remaining the most expensive at $150–$200/MWh.
IESR's geospatial analysis found 333 GW of commercially viable solar, wind, and mini-hydro projects under the current ceiling price tariff structure, with 91 GW of solar and 86 GW of wind having an internal rate of return above 10% (IETO 2026, pp. 79–80).
What LCOE is actually good for
LCOE is useful, but it's also a massive oversimplification. Not knowing the nuance of it can be troublesome. Before we critique it, let's look at cases where LCOE can serve us.
1. Comparing similar technologies serving the same role. If you're deciding between a coal plant and a gas combined-cycle plant — both dispatchable, both baseload — LCOE gives you a valid apples-to-apples comparison (WRI). The same applies to comparing two solar farms in similar locations.
2. Tracking technology cost trends over time. When IRENA says solar LCOE fell 90% since 2010, that's a meaningful statement about manufacturing scale, learning curves, and module efficiency — not about system value.
3. Screening projects for viability. If a project's LCOE is above your expected wholesale price, you probably shouldn't build it (unless you have a PPA that says otherwise).
Now, we get to the blind spots, and why using it as the only decision metric leads to bad outcomes.
1. It ignores when electricity is generated
A solar farm that produces nothing at night has the same LCOE calculation regardless of whether it's in a grid with cheap daytime power or a grid with expensive evening peaks. But the value of that electricity is completely different.
As the World Resources Institute put it: "Not all electricity is created equal" (WRI). Electricity at 2 PM on a sunny Sunday is worth less than electricity at 7 PM on a hot weekday. LCOE treats both as the same unit.
2. It ignores system integration costs
This is the big one. Two technologies with identical LCOEs can impose vastly different total costs on the electricity system.
A gas plant that ramps up and down on command needs minimal grid support. A solar farm that floods the grid at noon and disappears at sunset needs backup generation, storage, transmission upgrades, and balancing services — none of which show up in its LCOE.
The Clean Air Task Force's 2025 report calls LCOE "an economic assessment of the cost of the energy-generating system" but notes it "does not account for the full electricity system cost necessary to deploy a generator at a large scale" (CATF, 2025). This includes transmission, distribution, and grid integration infrastructure.
Researchers have proposed alternative metrics like System LCOE (ScienceDirect, 2023), which adds balancing costs, grid costs, and profile costs to the generation cost. For variable renewables, the gap between LCOE and System LCOE grows as their share of the grid increases.
3. It's highly sensitive to financing assumptions
Change the discount rate (WACC) from 5% to 10%, and a solar farm's LCOE can jump by 40% or more. The OECD finds that raising WACC from 2% to 10% lifts solar LCOE by around 80% in OECD markets and about 34% in Indonesia — a 5-percentage-point swing sits in that range (OECD, 2024). For capital-intensive technologies like solar and nuclear, financing terms can be more decisive than hardware costs.
This is especially relevant for Indonesia, where the cost of capital for renewable projects is significantly higher than in OECD markets. IRENA's Indonesia Energy Transition Outlook (2022) put Indonesia's solar WACC at around 6% (IRENA, 2022), but developers report effective rates well above that due to currency risk, offtaker risk, and regulatory uncertainty.
4. It assumes the plant operates in isolation
LCOE treats each power plant as a standalone unit. But in reality, grids are systems. Adding 1 GW of solar to a grid that already has 5 GW of solar is different from adding the same 1 GW to a grid with zero solar. The marginal value decreases as penetration increases — a phenomenon LCOE can't capture.
What this means for Indonesia
The LCOE numbers say solar is already competitive with coal in Indonesia. The IESR data is clear: solar tariffs can undercut PLN's existing generation costs in almost all major grids.
But LCOE competitiveness does not equal bankability. That gap — between what the metric says and what actually gets built — is where the real story is.
Indonesia's solar auction prices of $45–$55/MWh are competitive on paper. Yet solar and wind together still account for just 0.5% of Indonesia's electricity generation (Ember, 2025). The bottlenecks are not cost — they're structure: local content requirements that inflate upfront costs, a single-buyer model that limits PPA structures, transmission constraints in high-sun areas like NTT, and the absence of a carbon price that would make coal's externalities visible in the LCOE comparison.
This is precisely the kind of situation where LCOE alone is misleading. It tells you that solar should be getting built. But it doesn't tell you why it isn't.
Open questions
How much does Indonesia's higher cost of capital actually add to solar and wind LCOE? Most published numbers use global financing assumptions. A truly Indonesia-specific LCOE — with real WACC, real currency hedging costs, and real local-content premiums — would be more useful than another generic benchmark.
At what penetration level do system integration costs start to matter for Java-Bali? Currently, variable renewables are a tiny fraction of the grid. But 2030 targets could push that share to 15–20%. At that point, LCOE comparisons between solar and gas will need a system-cost adjustment.
Would switching from LCOE to avoided-cost analysis change PLN's procurement decisions? If the metric shifted from "what's the cheapest generation cost" to "what's the cheapest way to meet our load at every hour," would the resource mix look different?
What's the LCOE of coal in Indonesia when coal is priced at export parity instead of DMO? The domestic coal price cap of $70/tonne (implemented via DMO) effectively subsidizes coal generation. An IEA report estimated this subsidy at roughly $7–$11/MWh (OECD/IEA 2022). The "real" LCOE of coal in Indonesia may be higher than advertised.